 Analytics
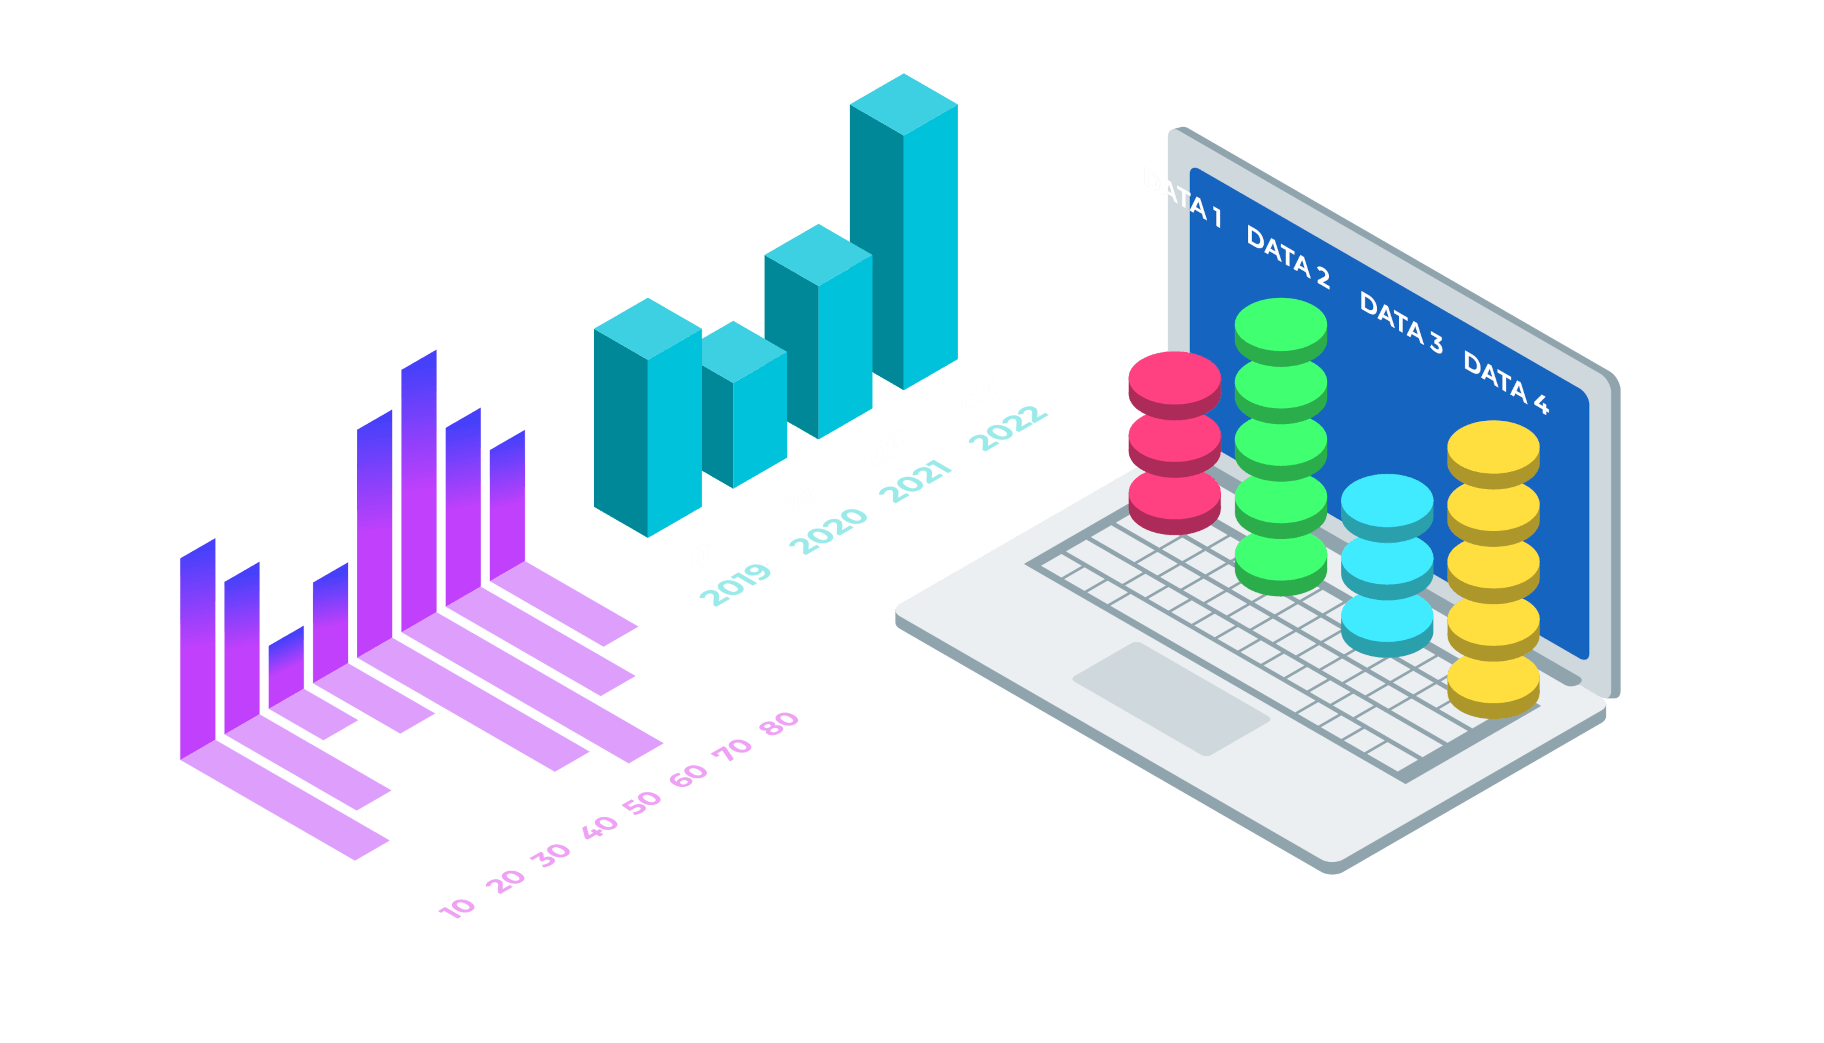
 TapXReality’s advanced analytics dashboard gives you real-time insights into your AR projects. Track key metrics like scan counts, unique visitors, device types, and locations to understand user engagement and optimize your content. Make data-driven decisions and maximize the impact of your AR experiences with comprehensive analytics at your fingertips.

Explore TapXReality’s Advance Analytics capabilities, designed to provide a comprehensive understanding of your AR projects. This section covers in-depth reporting, real-time insights, advanced data visualization, and customizable data analysis to help you interpret results effectively and make informed decisions.

Monitor your AR project’s performance in real time with detailed data on scans, interactions, and user engagement. Stay updated with instant access to key metrics as they unfold.
Gain valuable insights into how many unique users are interacting with your AR content. Understand user behavior to tailor and improve experiences for diverse audiences.
Track which devices your users are accessing your AR content from and analyze their geographic locations. This data helps you optimize for different platforms and target specific regions more effectively.
Leverage analytics to make informed, data-driven decisions. Identify trends, understand user preferences, and optimize your AR projects for higher engagement and better results.

TapXReality offers a detailed and comprehensive reporting system that gives you a clear picture of your AR project’s performance. With in-depth analytics, you can make informed decisions to optimize your content and maximize engagement.


 Analytics
 With TapXReality’s real-time analytics, you get instant access to crucial data about your AR projects. Monitor user engagement, optimize experiences, and make timely adjustments based on live insights to enhance the performance of your AR content.

TapXReality’s Customizable Filters feature allows you to refine and analyze performance data with precision. Tailor your data views by applying filters to focus on specific metrics, demographics, or time periods, enabling more targeted insights and effective decision-making.
Utilize customizable filters to drill down into specific aspects of your AR project data. Adjust filters to focus on particular demographics, device types, or time frames, ensuring that you analyze the data most relevant to your needs.
Customizable filters streamline your data analysis by allowing you to isolate and examine relevant subsets of data. This targeted approach makes it easier to draw actionable insights and make informed decisions based on specific criteria.
Leverage filtered data to improve decision-making processes. By focusing on specific segments or metrics, you can better understand areas for improvement, measure the impact of changes, and drive strategic actions based on detailed insights.


TapXReality’s analytics platform offers powerful data visualization tools that transform raw data into intuitive graphs and charts. These visuals help you quickly understand the performance of your AR projects, enabling better decision-making and optimization.

Visualize performance analytics with various charts and graphs. From bar charts to pie charts, these visual aids help represent data in an easily interpretable format, making it simpler to identify trends and patterns.
Track changes and trends over time with dynamic visualizations. Trend analysis tools help you observe how AR project performance or engagement evolves, providing insights into the effectiveness of your AR project.
Export your visualizations in various formats such as PNG, PDF, or SVG. Share these visuals with stakeholders or integrate them into reports for a more effective presentation of your data analysis.


TapXReality provides a comprehensive suite of performance metrics to help you evaluate the success of your AR projects. From user engagement to technical efficiency, these insights allow you to refine your content and maximize its impact.
Track the number of total scans and unique users engaging with your AR content. This data helps measure overall reach and individual user interest.
Measure how long users interact with your AR content. Longer engagement times indicate higher levels of interest, allowing you to identify which content resonates most with your audience.
Gain insights into which devices and platforms are used to access your AR content, helping you optimize for the most popular devices and ensure a seamless experience across all platforms.
Analyze geographic data to understand where your content is being accessed. This helps in targeting specific regions or understanding global reach and audience distribution.


 and Share Data
 TapXReality makes it easy to export and share your AR analytics data with stakeholders, ensuring collaboration and informed decision-making. With customizable export formats and secure sharing options, you can seamlessly distribute insights and performance reports.


Join TapXReality today and unleash the potential of augmented reality. Create, share, and engage with immersive AR content effortlessly.
Transform your projects and captivate your audience like never before!